The better a species has adapted to the given conditions of its habitat, the more individuals it has, and the less likely it is, that another species becomes dominant. In a plant community only few species are really common. These species , too, make up the main percentage of the energy turnover of the respective trophical level (in this case that of the primary producers). The rarer species increase the diversity of the system. As a measure for the diversity, the species diversity index has been developed that describes the relation of the number of species towards their frequency (measured as number, biomass, and rate of reproduction).
Ecosystems that are limited in their development due to chemical or physical factors are characterised by a low number of species (boreal zones, deserts). The number of species is high in systems that are regulated mainly by biological factors. The biodiversity does in general increase with a decreasing ratio of necessary maintenance energy and biomass. This leads us back to the postulate of the physicist E. SCHRÖDINGER who coined the axiom ‘order that is based on order’ in his article "What is life?" in 1943 (see also self-organisation of matter). The variety of species is thus directly related to the stability of a system, and there exists a linear connection between the number of species and the number of individuals per species.
Especially the number of rarer species decreases under pollution with chemical or physical factors. These relations can be expressed by an equation that is called the SHANNON-WEAVER function or the SHANNON-index after its discoverers. An increase in the number of species causes longer food chains and thus more complex food networks. It increases, too, the number of interactions between species like symbiosis, parasitism or commensalism.
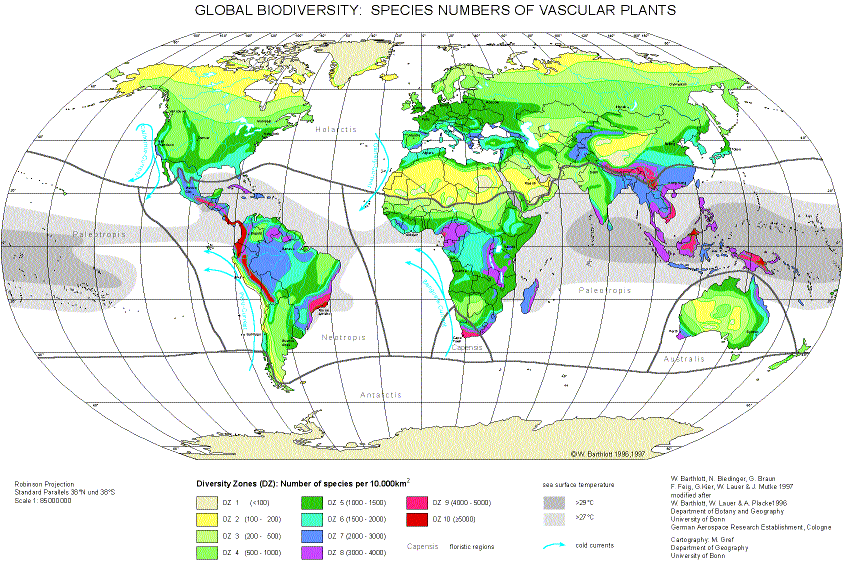
An annotated, coloured world map of the potential species diversity of vascular plants to serve as a basis for a future world map of biodiversity is presented below. (from: BARTHLOTT, W., BIEDINGER, N., BRAUN, G., FEIG, F., KIER, G & MUTKE, J. 1999: Terminological and methodological aspects of the mapping and analysis of the global biodiversity. — Acta Bot. Fennica 162: 103–110.)

A world map of the potential species diversity of terrestrial vascular plants based on the evaluation of approximately 1400 records from literature is presented. The evaluation of data from approximately 1400 floras, floristic studies, biogeographical essays and vegetation studies, regional to continental in scope, provides the mainstay for our map. The species numbers of the areas covered (predominantly political units) is calculated for a standard area of 10 000 sq. km. by a benchmark formula. Ten diversity zones in categories within the spectrum of less than 100 species and more than 5000 species per 10 000 sq. km. have been considered and mapped by ten colour indicators. Because political, and not natural, units constituted the data utilized, zonation boundaries of those areas with equal taxa density (isotaxas) are inferred on the basis of climatic and other data.
In the context of the elaboration of the map, it became clear that certain terminological and methodological issues need to be clarified. Based on the existing literature, a terminology for the classification of plants according to the mode and time of their first occurrence in the study area, and for the respective diversities, is introduced. It is particularly important to distinguish between the autodiversity, i.e. the diversity of indigenous plants (autophytes), and the allodiversity, i.e. the diversity of plants introduced by man (allophytes). In addition, for other purposes it is more important to distinguish between the eudiversity, i.e. the diversity of autophytes and plants introduced with the former continuous migration of man (archaeophytes), and the neodiversity, i.e. the diversity of plants dispersed by man over large distances, usually resulting in distribution gaps (neophytes). Neodiversity is increased tremendously by neoterodiversity, i.e. the diversity of plants dispersed in the context of motorised mass transportation since the end of the last century (neoterophytes, "invaders").
This world map diverges in significant details from hitherto acknowledged concepts of the distribution of diversity (e.g. the Cameroon-Gabon Centre is identified as a diversity maximum for Africa for the first time). We recognize six global species maxima: 1. Chocó-Costa Rica Centre, 2. Tropical Eastern Andes Centre, 3. Atlantic Brazil Centre , 4. Eastern Himalaya-Yunnan Centre, 5. Northern Borneo Centre, 6. New Guinea Centre.
The results are elucidated by explanatory comments and critical discussion. Inevitably, a number of terminological issues must be clarified (e.g. isotaxas - isoporia, diversity maxima, diversity centres, criteria governing the quality of diversity, landscape diversity - geodiversity - ecodiversity, etc.). As is to be expected, the biodiversity of an area does not depend solely on its history (climatic and floristic history, palaeogeography and evolutionary availability of genetic diversity) or its position (degree of isolation and zonobiom), but also on the whole variety of its abiotic parameters (geodiversity). In this context, a connection becomes apparent between tropical diversity maxima and oceanic surface temperatures of more than 27°C. With reference to and in the context of the well documented interdependent ecosystem of primary producers (vascular plants) with consumers and decomposers, we suppose that the map reflects quite accurately the global distribution of terrestrial biodiversity in its entirety.

|